- Important information
- New features
- Known problems
- Program corrections
- User guide corrections
- Miscellaneous
- Release history
Important information
-
SWO features are available also for devices without SWO
This is to allow power debugging even when the device doesn't support SWO. Internally in C-SPY, power samples are delivered over the same interface as SWO data, and are treated as pseudo-SWO packets.
New features
-
Support for MTB (Micro Trace Buffer)
The MTB trace mechanism gives access to instruction trace on devices based on the Cortex-M0+ core.
Known Problems
-
Download and debug with cspybat does not work with the driver for I-jet and JTAGjet.
[EW23504] -
"Match value" for data breakpoints is ignored by I-jet.
[EW23505] -
If two images are loaded, and both contains the
__vector_tablesymbol, then a confusing debug log is generated.
[EW23506] -
The intrinsic function
__WFIdoes not work with I-jet.
[EW23533] -
Current limitations in the MTB (Micro Trace Buffer) implementation
The Trace Start/Stop/Filter breakpoints is not functional.
The timestamps for MTB trace records come from a simple counter and have no relation to cpu/clock cycles. Any conversion between cycles and time for MTB trace data will be misleading. The Call Stack graph in the Timeline window, for example, should not be used to measure time intervals.
The MTB trace data sequence may not present discontinuities correctly. Lines in the ETM Trace window (also used for MTB trace) may be marked as discontinuous, i.e. red, even though the trace sequence is contiguous. Conversely, trace data from a buffer that has overflowed will not always be marked as discontinuous. This is mostly a cosmetic problem, except for the Call Stack graph in the Timeline window, which only displays the latest continuous sequence of trace data.
The ETM Trace window (and related windows) are used for all variants of full instruction trace, ETM, ETB and MTB.
Program Corrections
-
The C-SPY driver for I-jet is now enhanced to serve JTAGjet as well.
[EW23152] -
Debugging on Freescale i.MX25 is now possible without workaround.
[EW23364]
User guide corrections
-
The Project->Options...->I-jet/JTAGjet->JTAG/SWD options page is modified in version 6.50.2. The description of this page in the C-SPY Debugging guide shall be modified according to the following description:
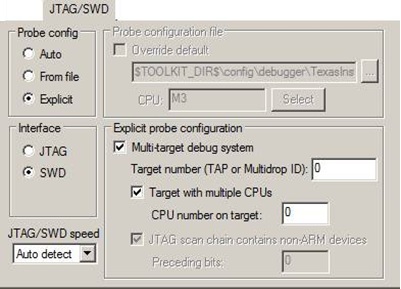
Probe config
Selects a probe configuration method
Auto
The I-jet driver will automatically identify the target CPU. It will use the default probe configuration file if any. This works best if there is only one CPU to find.From file
Specifies that the probe configuration file needs to be overridden, or there are several target CPUs. See Probe configuration file below.Explicit
Specify manually how to find the target CPU. See Explicit probe configuration below.Interface
According to the C-SPY Debugging guide.
JTAG/SWD speed
According to the C-SPY Debugging guide.
Probe configuration file
Use Override default to specify a probe configuration file to be used instead of the default probe configuration file that comes with the product package.
Click Select to select the CPU to use. Then a dropdown list of available CPUs defined in the specified probe configuration file is displayed.
Explicit probe configuration
Select Multi-target debug system if the debugging system consists of more targets than a single CPU.
If the debugging system is a multi-drop SWD, specify the Target number Multidrop ID (hexadecimal) of the DAP where your CPU is located.
If the debugging system is a multi-core SWD, specify the CPU number on target, i.e. the CPU number on the DAP.
If the debugging system is a JTAG scan chain, specify the Target number TAP (Test Access Port) position of the device you want to connect to. The TAP numbers start from zero. If there are several CPUs at the TAP position, you also need to specify the CPU number on target.
JTAG scan chain contains non-ARM devices and Preceding bits: According to the C-SPY Debugging guide.
Miscellaneous
- None.
Release history
V6.40 2012-06-05
Program correctionsTHUMB breakpoints that end up in the same 32-bit word are now handled correctly by C-SPY.
[EW23243]When debugging on an AM1808 device with I-jet you no longer get warnings about misplaced SFRs.
[EW23289]-
In EWARM 6.40.5:
I-jet now works with TMS470R1B1M.
[EW23310] -
In EWARM 6.40.5:
C-SPY no longer terminates unexpectedly when closing a debug session.
[EW23370, EW23531] -
In EWARM 6.40.5:
I-jet now works with LPC2138. Note, reset strategy must be set to "Hardware" or "Software".
[EW23427, EW23442, EW23443] -
In EWARM 6.40.5:
Turning on "Power Sampling" in the Function Profiler window could sometimes cause a crash, e.g. if Profiling was turned on already when launching a debug session, but Power Sampling was turned on later. This has been fixed.
[EW23509] -
In EWARM 6.40.5:
Creating or editing configurations in the Memory Configuration dialog box when running a session in Japanese could cause IAR Embedded Workbench to exit unexpectedly. This has been corrected.
[EW23513] -
In EWARM 6.40.5:
I-jet now works with LPC2378. Note, reset strategy must be set to "Hardware" or "Software" and JTAG/SWD speed must be set to "Adaptive".
[EW23515]
- None.
V6.30 2011-10-22
Program corrections- None.
- None.
- None.