|
|
|
1
|
Choose Project>Options and then the Debugger category. On the Setup page, make sure that you have chosen Simulator from the Driver drop-down list and that Run to main is selected. Click OK.
|
|
2
|
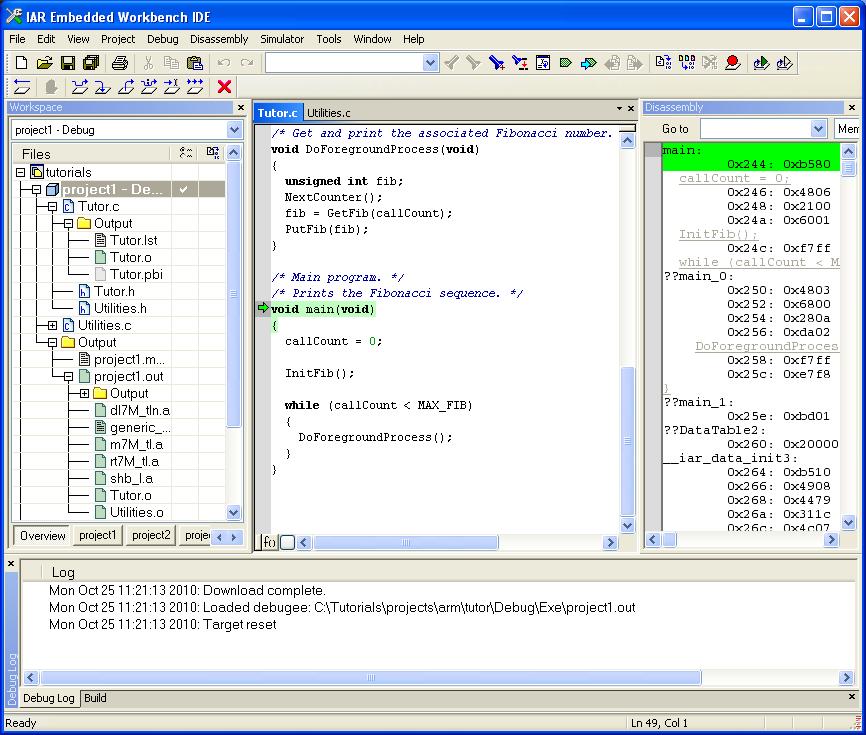
Choose Project>Download and Debug. Alternatively, click
|
|
1
|
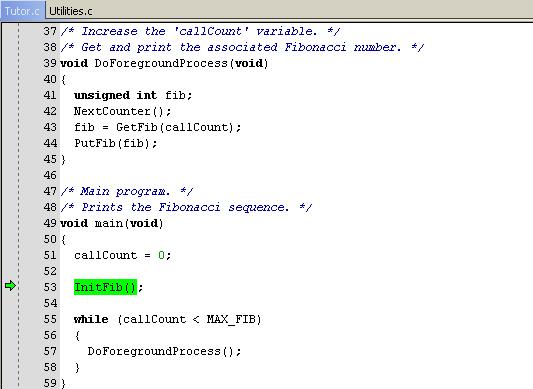
To inspect the source statements, double-click the file Tutor.c in the Workspace window.
|
|
2
|
With the file Tutor.c displayed in the editor window, first step over with the Debug>Step Over command.
|
|
3
|
|
4
|
|
5
|
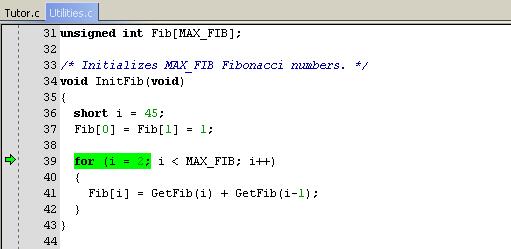
Use Step Over until you are back in the header of the for loop. Notice that the step points are on a function call level, not on a statement level.
|
|
1
|
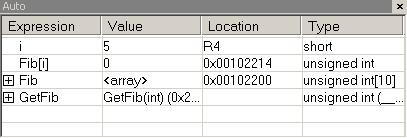
Choose View>Auto to open the Auto window.
|
|
3
|
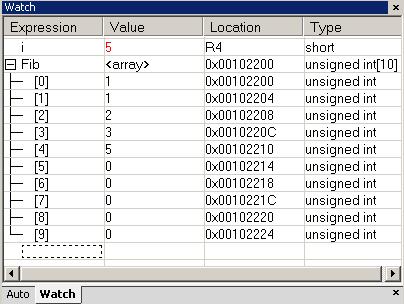
Choose View>Watch to open the Watch window. Notice that it is, by default, grouped together with the currently open Auto window; the windows are located as a tab group.
|
|
4
|
Set a watchpoint on the variable i using this procedure: Click the dotted rectangle in the Watch window. In the entry field that appears, type i and press the Enter key.
|
|
5
|
|
6
|
|
1
|
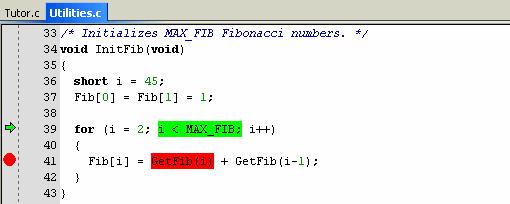
Set a breakpoint on the function call GetFib(i) using this procedure: First, click the Utilities.c tab in the editor window and click in the statement to position the insertion point. Then choose Edit>Toggle Breakpoint.
|
|
3
|
Select the breakpoint, right-click and choose Toggle Breakpoint (Code) from the context menu, alternatively choose Toggle Breakpoint from the Edit menu to remove the breakpoint.
|
|
1
|
|
2
|
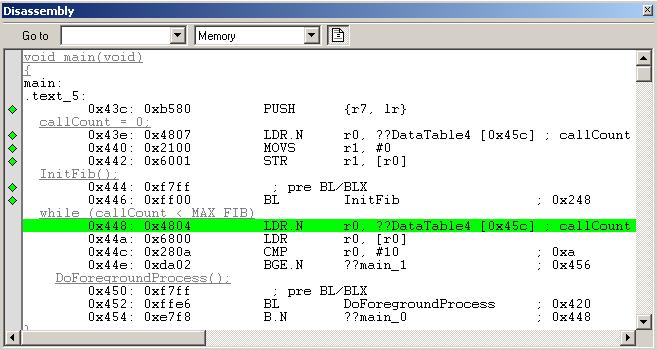
Choose View>Disassembly to open the Disassembly window, if it is not already open.You will see the assembler code corresponding to the current C statement.
|
|
1
|
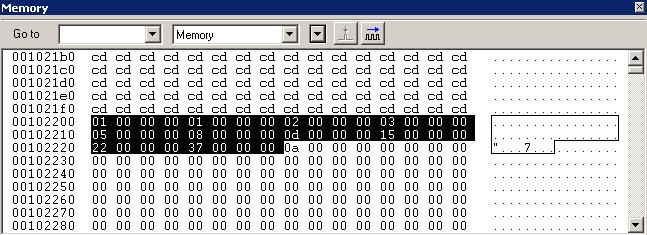
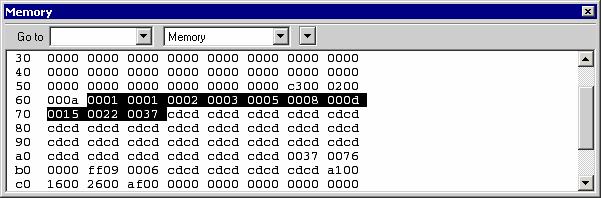
Choose View>Memory to open the Memory window.
|
|
2
|
Make the Utilities.c window active and select Fib. Then drag it from the C source window to the Memory window.
|
|
3
|
To display the memory contents as 16-bit data units, choose the x2 Units command from the drop-down arrow menu on the Memory window toolbar.
|
|
1
|
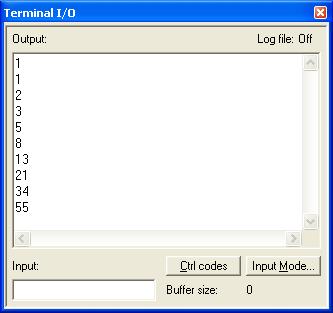
Choose View>Terminal I/O to display the output from the I/O operations.
|
|
2
|
To exit from C-SPY, choose Debug>Stop Debugging. Alternatively, click
|